ios-personmd-notifications md-help-circle

Profile

  • Guest
    medal 0
  • Posts: 21
  • Post Likes: 3765

Notifications

  • No Unread Notifications

Suggested
Standings and visuals

warning
This thread is closed. Threads older than 6 weeks are closed automatically. To continue this discussion, create a new thread.
angle-double-left ios-arrow-back 1 ios-arrow-forward angle-double-right
md-lock This topic has been closed by the moderator
medal 5000
6 years 245 days ago
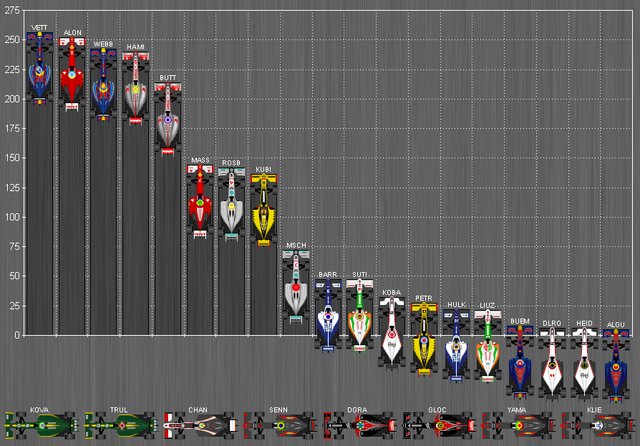
Me and my leaguemate used to make charts, detailed standings and other visuals like a fight for the championship curve but we stopped as it was very time consuming to collect all the race data manually, so I think it would be not very difficult and definitely very cool to collect the data automatically and convert it into graphical information, so people could see, how many wins, poles and fastest laps they got throughout the season and how close other championship claimants were. 
I mean something like what we did would be cool at least 
700x500
600x200
But visuals like this are even better (so we could finally see each other's liveries lol) 
md-quotelink
medal 5176
6 years 242 days ago
Personally, I like this idea, it's always fun to see information laid out in a simple and graphically pleasant manner.
md-quotelink
medal 5000
6 years 242 days ago
I really like this, had such a table over the past seasons till my laptop crashed or something and lost it :-(
I don't know if this will take too much data and room, but if not, I would really like to see this.
md-quotelink
medal 5000
6 years 235 days ago
Glad to see you guys like the idea. I really hope something like this is going to be implemented, but if there is a way to collect the race results automatically so everyone who is interested in making those stats could use it would be already awesome
md-quotelink
medal 5000
6 years 234 days ago
I really like that. I’m a bit of a nerd for a bit more detail with stats. Or any chance to see liveries haha. Hopefully there would be a way to do it which isn’t too hard and we get it 
md-quotelink
medal 5019
6 years 231 days ago
We do similar in our league, it's a league of mates so we have tables of statistics i.e drivers wins, poles, fl's, then constructors wins and poles followed by championship victories drivers and constructors. Then wins and poles by nationality and most wins in a season etc. Always good to look back on them from time to time and see who the next dominant driver will be!
md-quotelink
medal 5000
6 years 228 days ago
A chart like Michael R has would be awesome. Seeing the other liveries would be cool, bc the only time I can see them is during the race and that is minimal.
Michael
Me and my leaguemate used to make charts, detailed standings and other visuals like a fight for the championship curve but we stopped as it was very time consuming to collect all the race data manually, so I think it would be not very difficult and definitely very cool to collect the data automatically and convert it into graphical information, so people could see, how many wins, poles and fastest laps they got throughout the season and how close other championship claimants were. 
I mean something like what we did would be cool at least 
700x500
600x200
But visuals like this are even better (so we could finally see each other's liveries lol) 


md-quotelink
md-lock This topic has been closed by the moderator
angle-double-left ios-arrow-back 1 ios-arrow-forward angle-double-right

You must be logged in to post a reply.